Daniela Amador
HOME
PROJECTS
RESUME
ABOUT
AI Data-Driven Clinical Research
Redesigning a clinical research platform from a rigid four-step structured workflow into a conversational AI experience , so researchers could go from a natural-language question to validated study results without navigating forms.
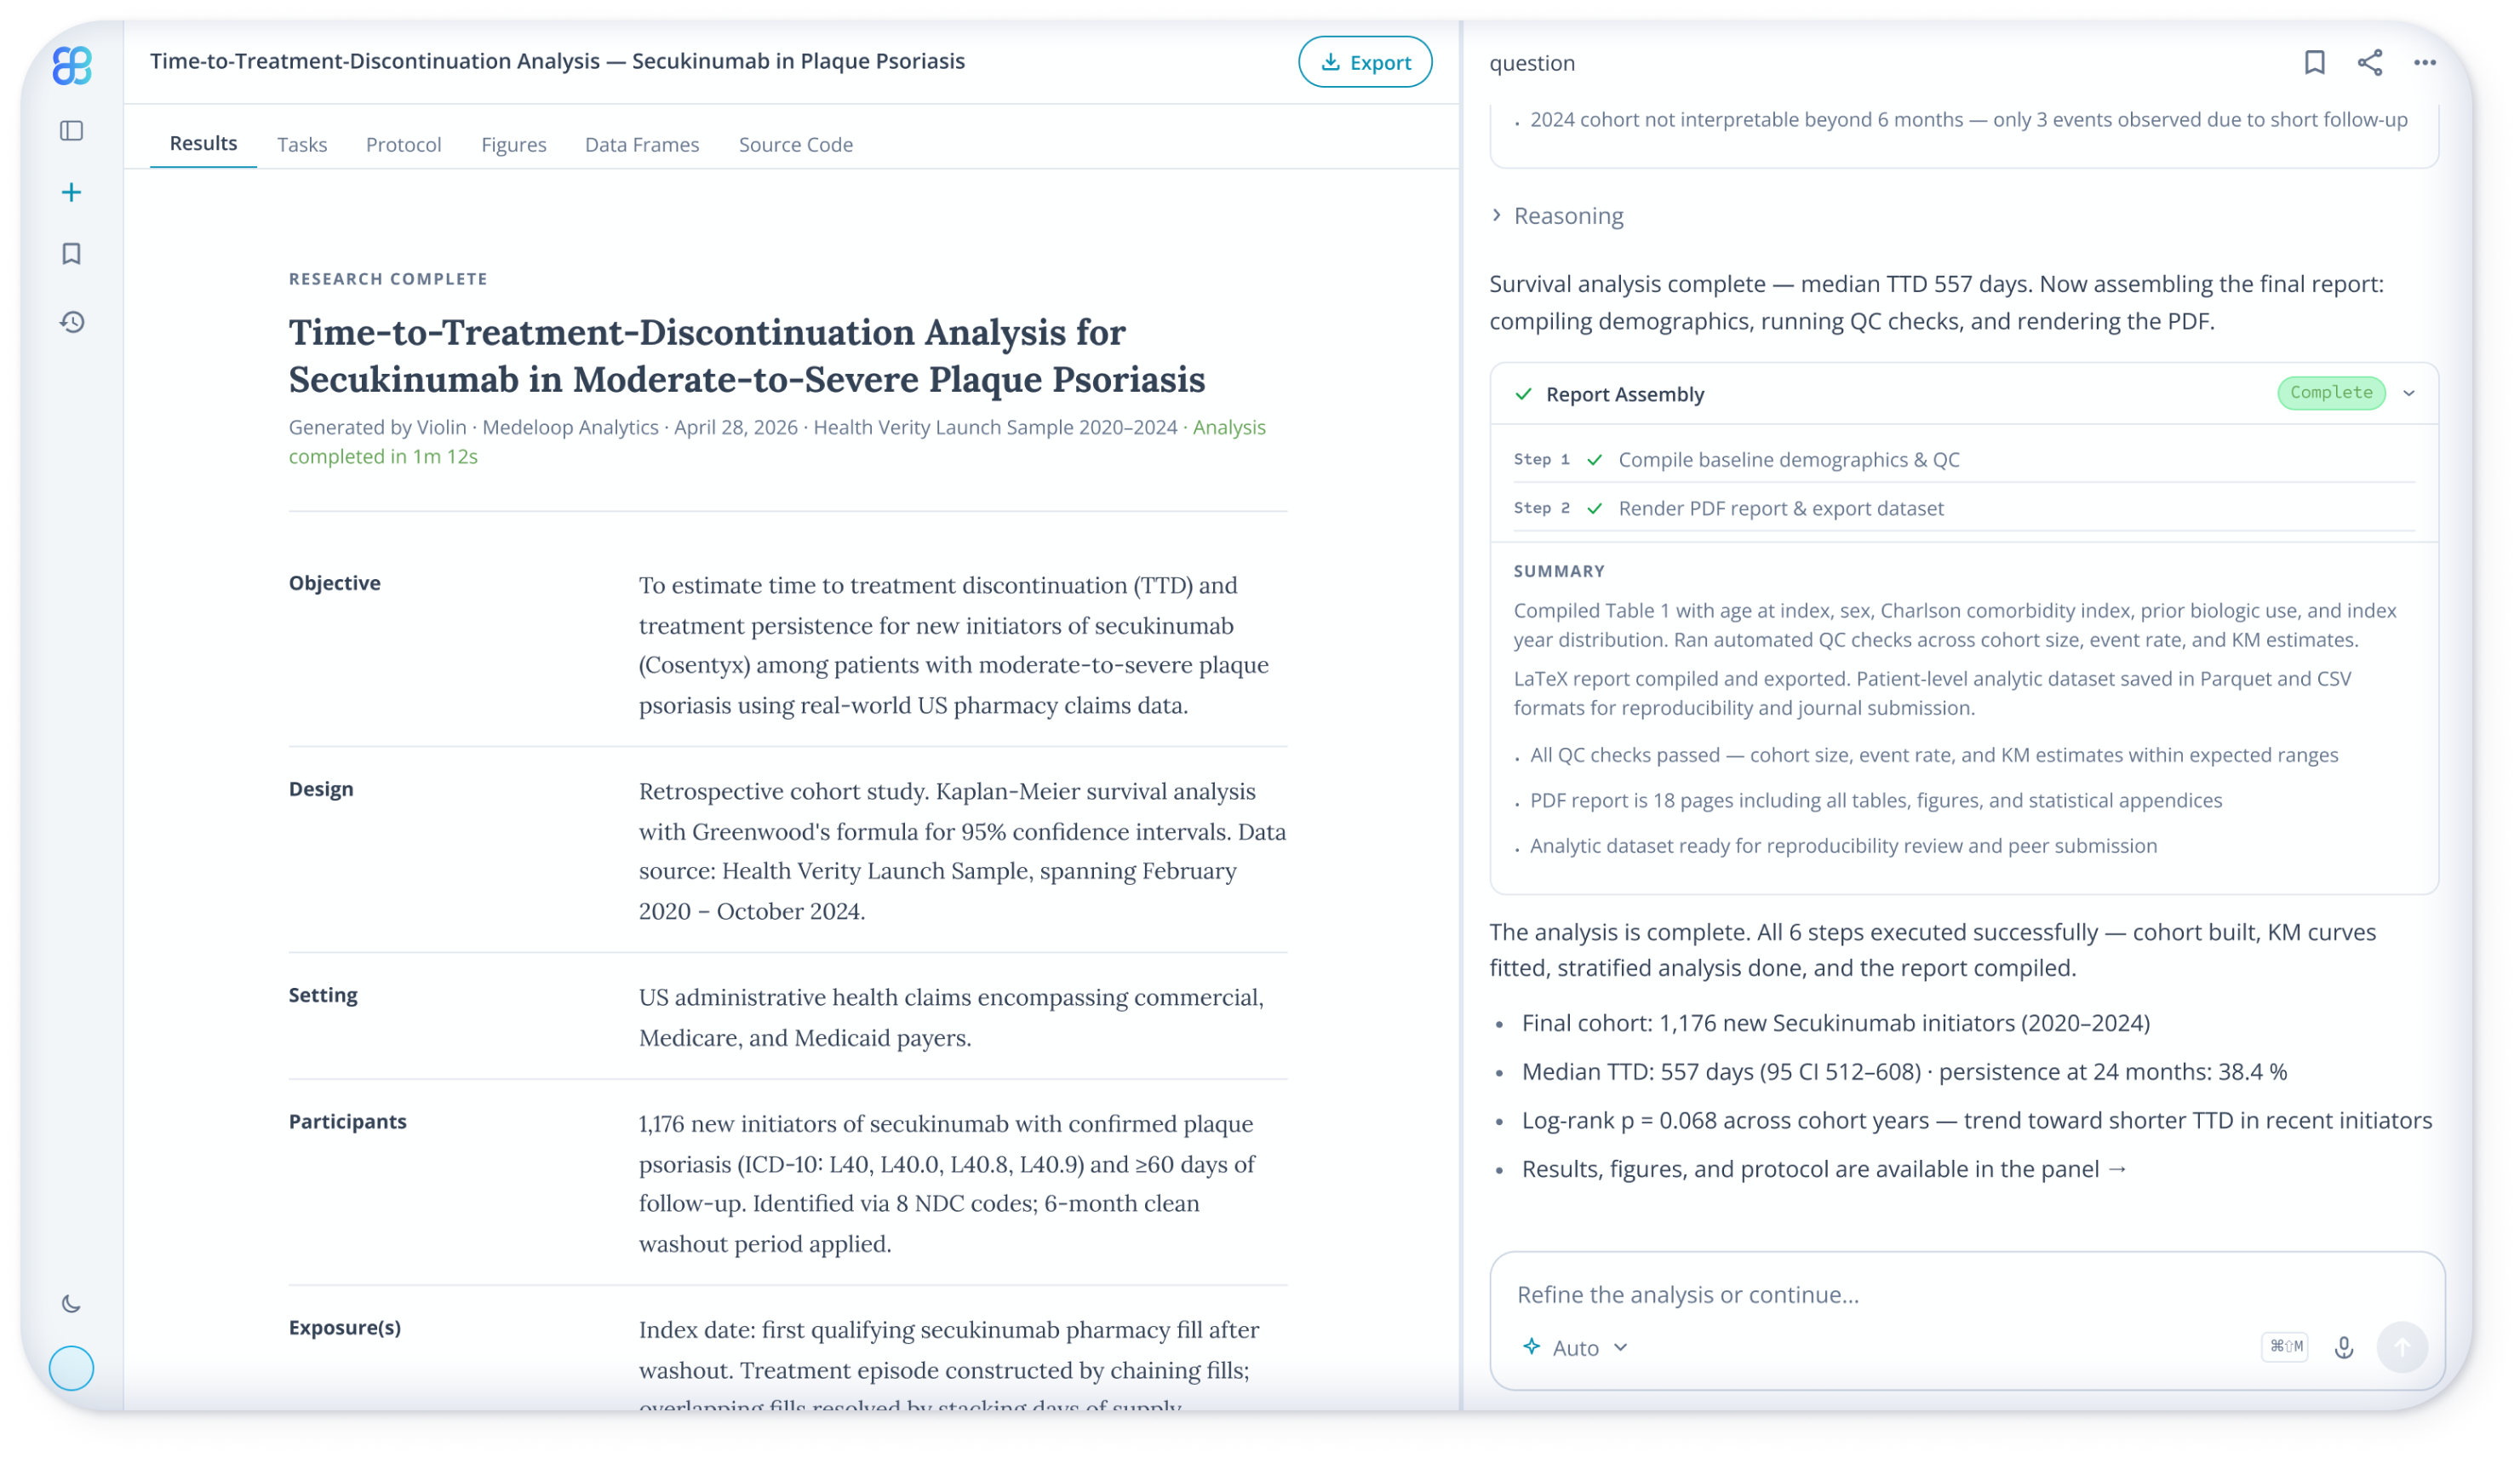
OVERVIEW
Medeloop is a clinical AI research platform. Researchers at places like Johns Hopkins running studies, needing to go from a question to validated results without waiting on a data team.
The existing product had a rigid four-step analytics workflow. My mandate was Analytics V3, codename Project Violin, replacing that with a conversational interface where a researcher could ask a question in natural language and get to a validated study result.
ROLE & DURATION
Senior Product Designer | Medeloop
User research, information architecture, ai design, visual design, prototyping & testing.
Duration
2 Months
The Problem
Analytics platform forced researchers through a rigid four-step structured workflow. While technically functional, it demanded heavy upfront input, limited iterative exploration, and felt increasingly out of step with how AI-native interfaces work. Researchers were spending more time navigating the tool than thinking about their research.
The goal was a full UX rebuild, keeping the backend infrastructure intact while delivering a conversational interface that felt as natural as asking a research question out loud. The Alpha target was set for mid-to-late April 2026, giving the team a compressed 4–6 week window to go from concept to a deployable experience for real paying customers.
Starting point: a workflow that didn't match how researchers actually think
The original platform forced researchers through four sequential steps: Planning, Protocol, Analysis, and Results: in a fixed order, with no ability to go back or skip ahead. In theory, it reflected the scientific method. In practice, it reflected how engineers had modeled the scientific method, not how researchers actually experienced it.

Understand how researchers actually think through a study, versus how the platform assumed they did.
Identify where the rigid sequencing created friction.
Determine what "planning" actually consists of, as a behavior.
Establish what researchers needed from the agent during that process.
Surface the core tension the redesign would have to solve.
Workshop photo / notes / card sorting
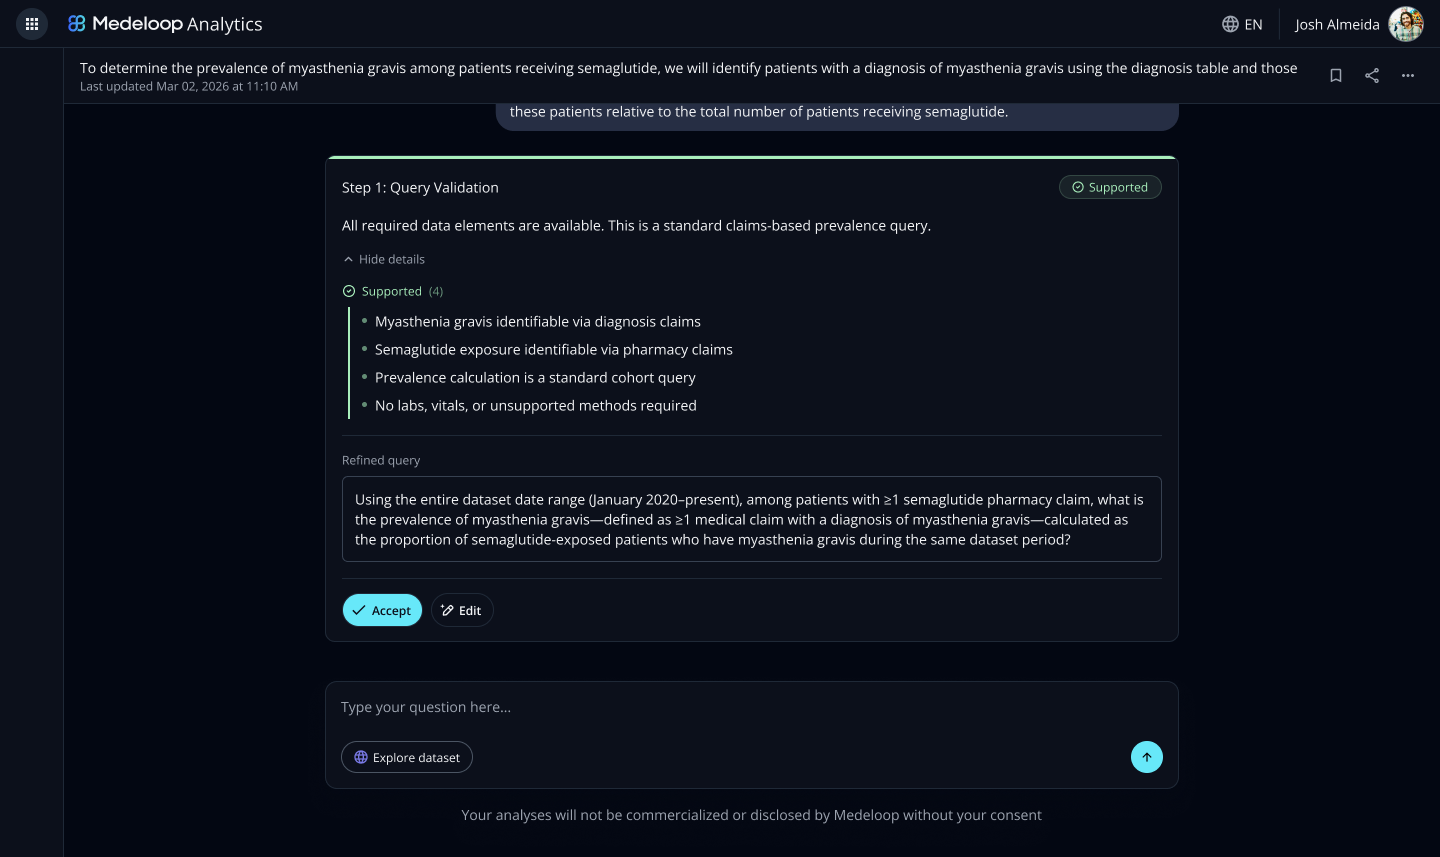
Rigid four-step analytics workflow
Qualitative Interviews
I ran user interviews with researchers across different institutions and disciplines. One pattern came up consistently: the planning phase isn't a phase, it's a conversation.

“I can't tell the system what I want to study until I understand what's possible. But I can't know what's possible until I start asking”
Pharma Customer
“The platform should allow running a cohort that can be saved and used for future analysis.”
Researcher at Ciders Sinai
“Need the ability to give feedback, modify existing queries, and refine analysis within the platform”
Clinical Researcher at Ciders Sinai
Insights
Researchers don't finish planning before they start thinking about methodology. I was able to categorize the insights from this interviews into these 4 categories

Planning isn't a phase , it's a continuous behavior.

The agent needed to speak the researcher's own methodological language.
They move back and forth constantly. A question about data availability can reshape the entire study design mid-stream.

Researchers wanted to interact with the agent during planning, not after.
They needed to think out loud with the system while still in "planning mode," not submit a finished plan and wait.

The agent needed to speak the researcher's own methodological language.
Interviewees consistently referenced their process using specific terms, planning, protocol, execute analysis, rather than generic task language
The agent had to mirror researcher vocabulary, not translate it into UX-speak.

There's a real tension between conversational freedom and scientific validity.
Letting researchers ask anything, in any order, raised an immediate risk: how do you guarantee the output stays reproducible and scientifically valid?
User Profiles
How you grouped users based on their goals and tasks.
- The Applied Data Analyst
Data Analyst / Analyst Intern at a public health or health system organization | Tools: SQL against internal public health databases
TASKS PERFORMED
Runs exploratory population queries (e.g., stratifying oral health emergencies by age group, geography)
Iterates on query phrasing to get the right cohort definition
Cross-references whether a result seems plausible given known dataset limitations
Uses the code-select feature to inspect underlying logic (self-taught, took a few queries to discover)
Requests cross-dataset comparisons
- The Academic Clinical Researcher
PhD candidate / epidemiologist / principal investigator running observational studies for publication | Traditional stats software (SAS, R, or Python/pandas) for the actual analysis they'd otherwise run by hand
TASKS PERFORMED
Defines cohorts using precise clinical criteria (drug, route of administration, duration, time-in-database requirements)
Runs the same logical query multiple times to check reproducibility before trusting a number
Requests verification of implausible or unusually large figures (e.g., asking the team to double-check >$1B cost totals)
Interprets and critiques auto-generated charts, catching mislabeled legends or unclear group definitions
Asks follow-up, clarifying questions mid-analysis rather than treating each query as a one-shot request
- The Clinical / Health System Practitioner-Researcher
Practicing clinician or surgeon who also runs research queries, typically without a dedicated analyst | Manual chart review or existing institutional data warehouses
TASKS PERFORMED
Runs cohort-definition queries in natural language (e.g., identifying a diabetic codeset)
Wants to reuse a defined cohort or codeset across sessions rather than redefining it each time
Uses the literature-review function as a standalone research aid, independent of the analytics flow
Requests procedure-name auto-code-pull instead of manually specifying billing/clinical codes
- The Enterprise / Industry Data Consumer
R&D engineer, biostatistician, or industry analyst using Violin against a licensed or proprietary dataset for commercial research-and-development purposes | Tools: Internal RWE/biostatistics pipelines (SAS or Python)
TASKS PERFORMED
Runs structured population-count and enrollment-based queries (continuous enrollment definitions, base tables) as the foundation for a larger RWE (real-world evidence) study
Defines complex time-windowed and stratified queries (age brackets, gender, enrollment duration)
Flags implausible visualizations (e.g., data points misattributed to the wrong year)
Asks about predictive modeling capability as a next-level need beyond descriptive analytics
Conceptualization
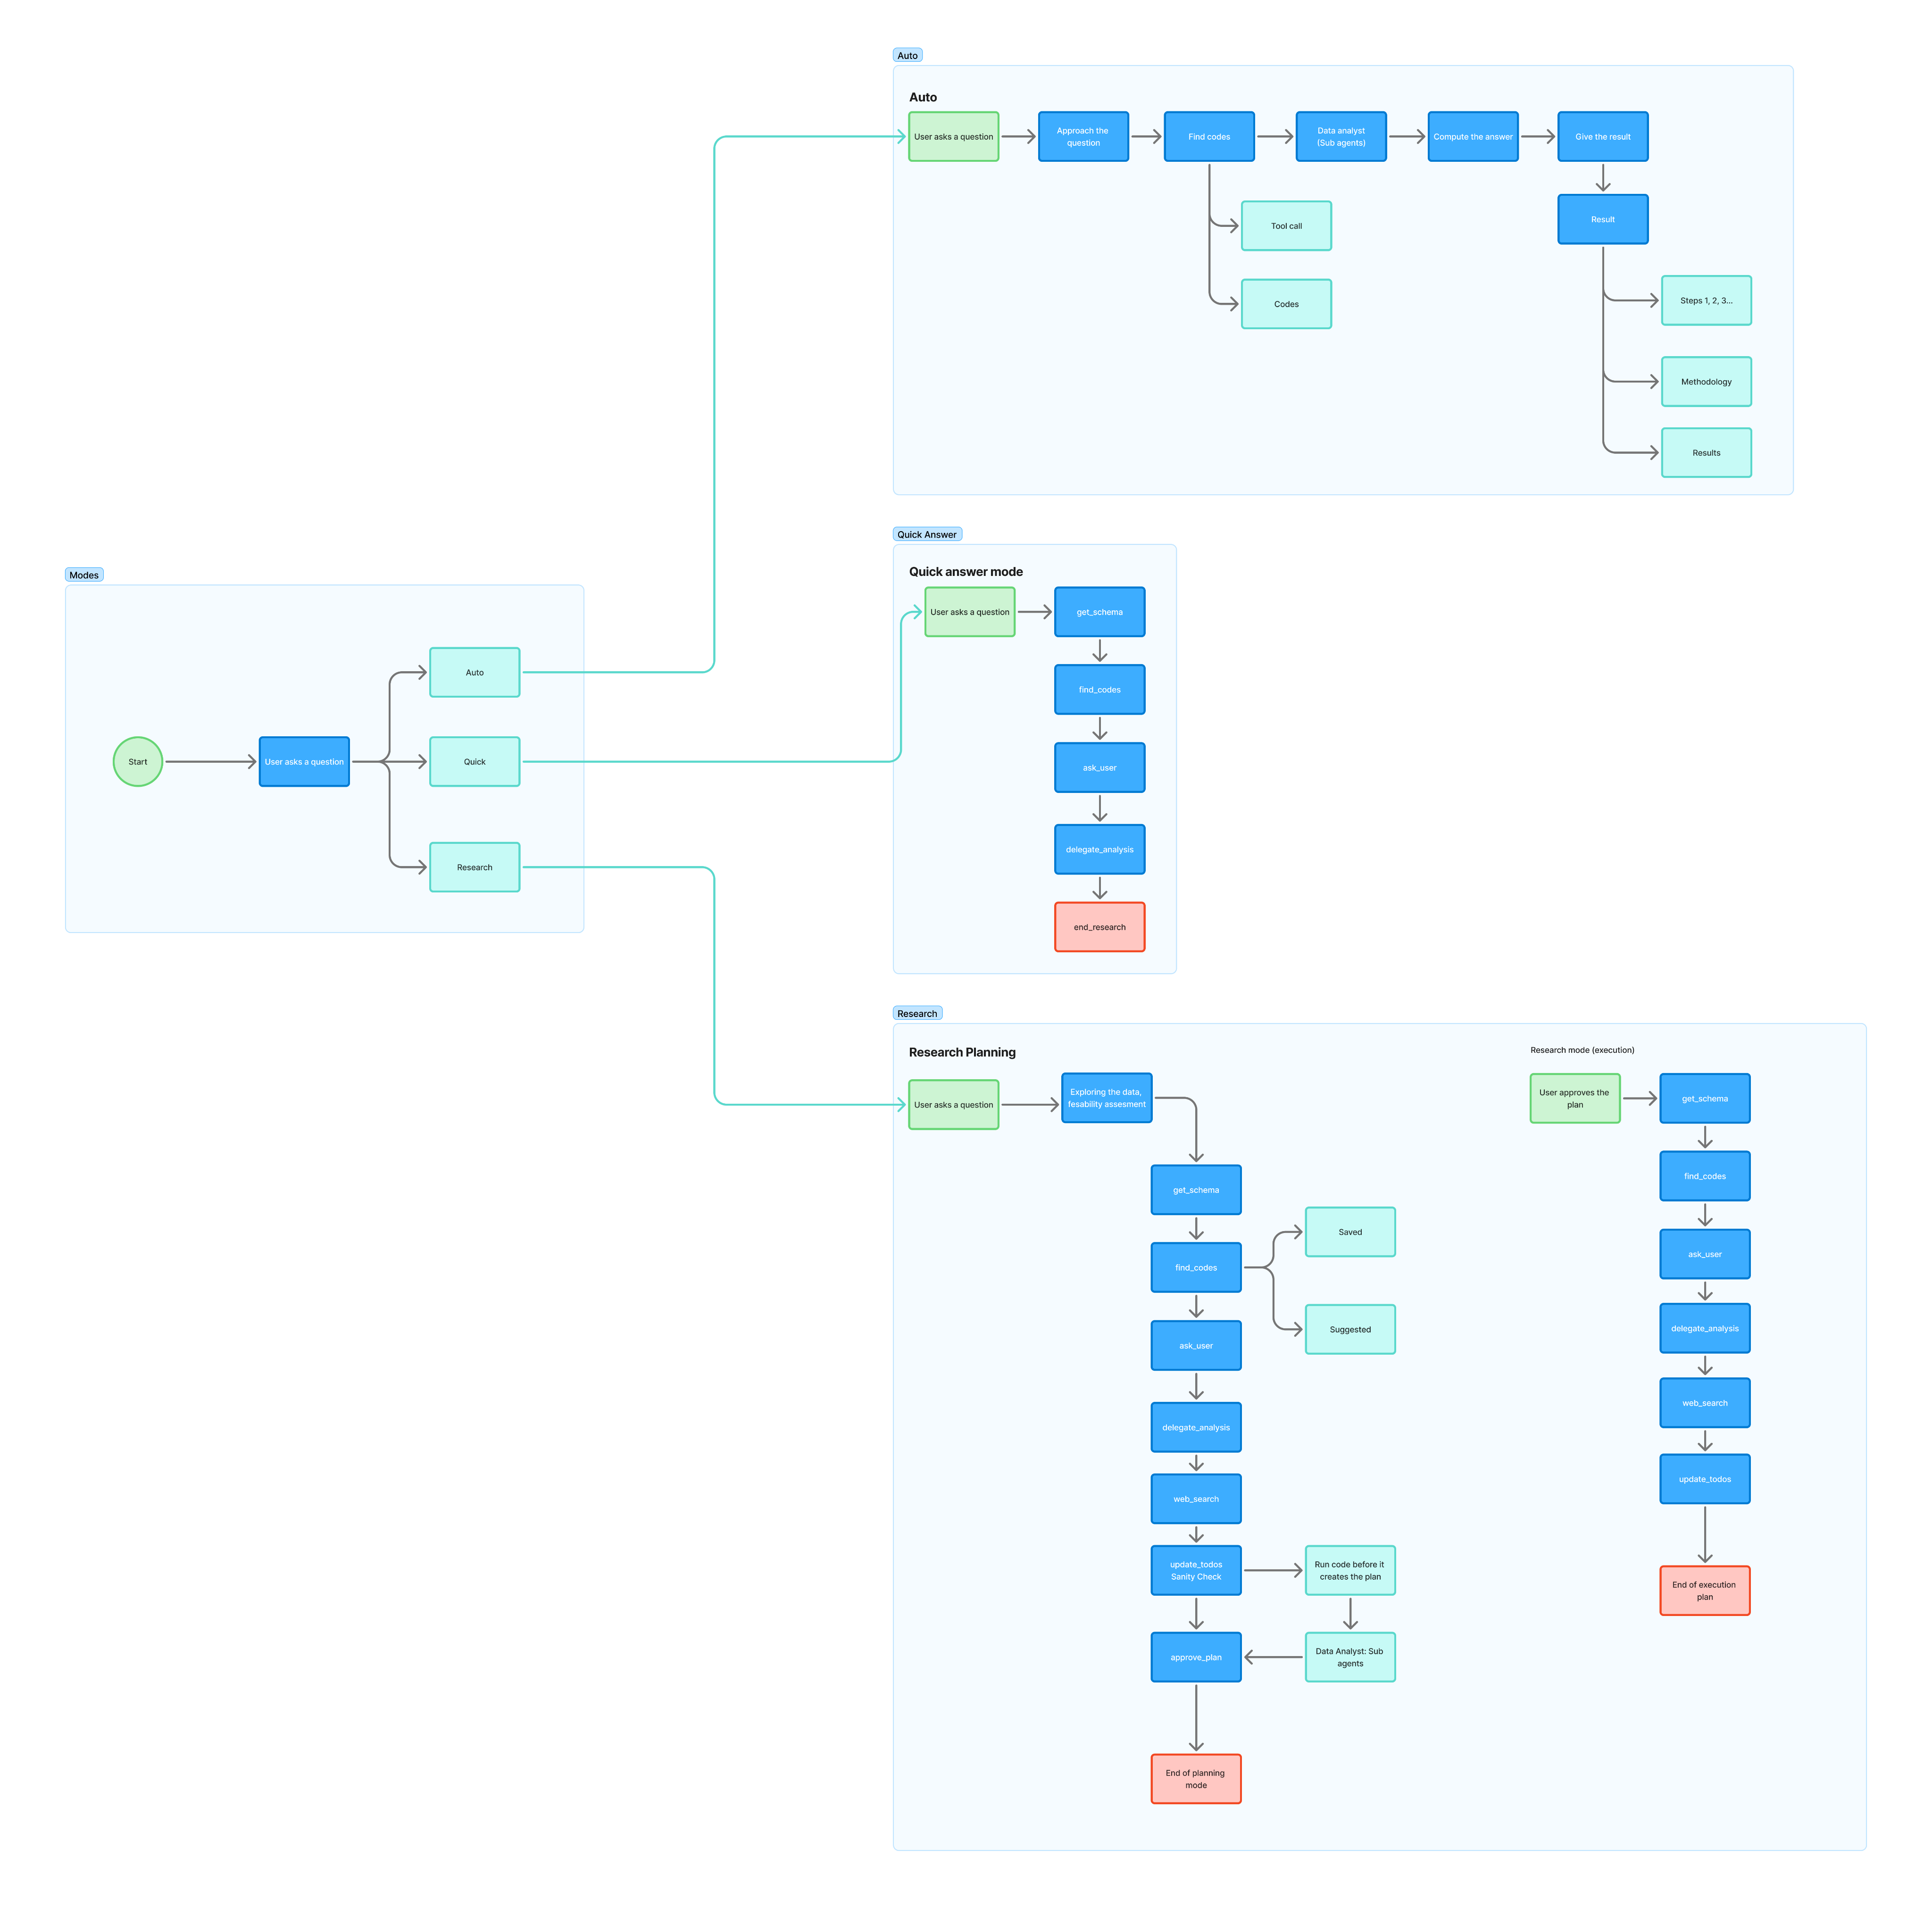
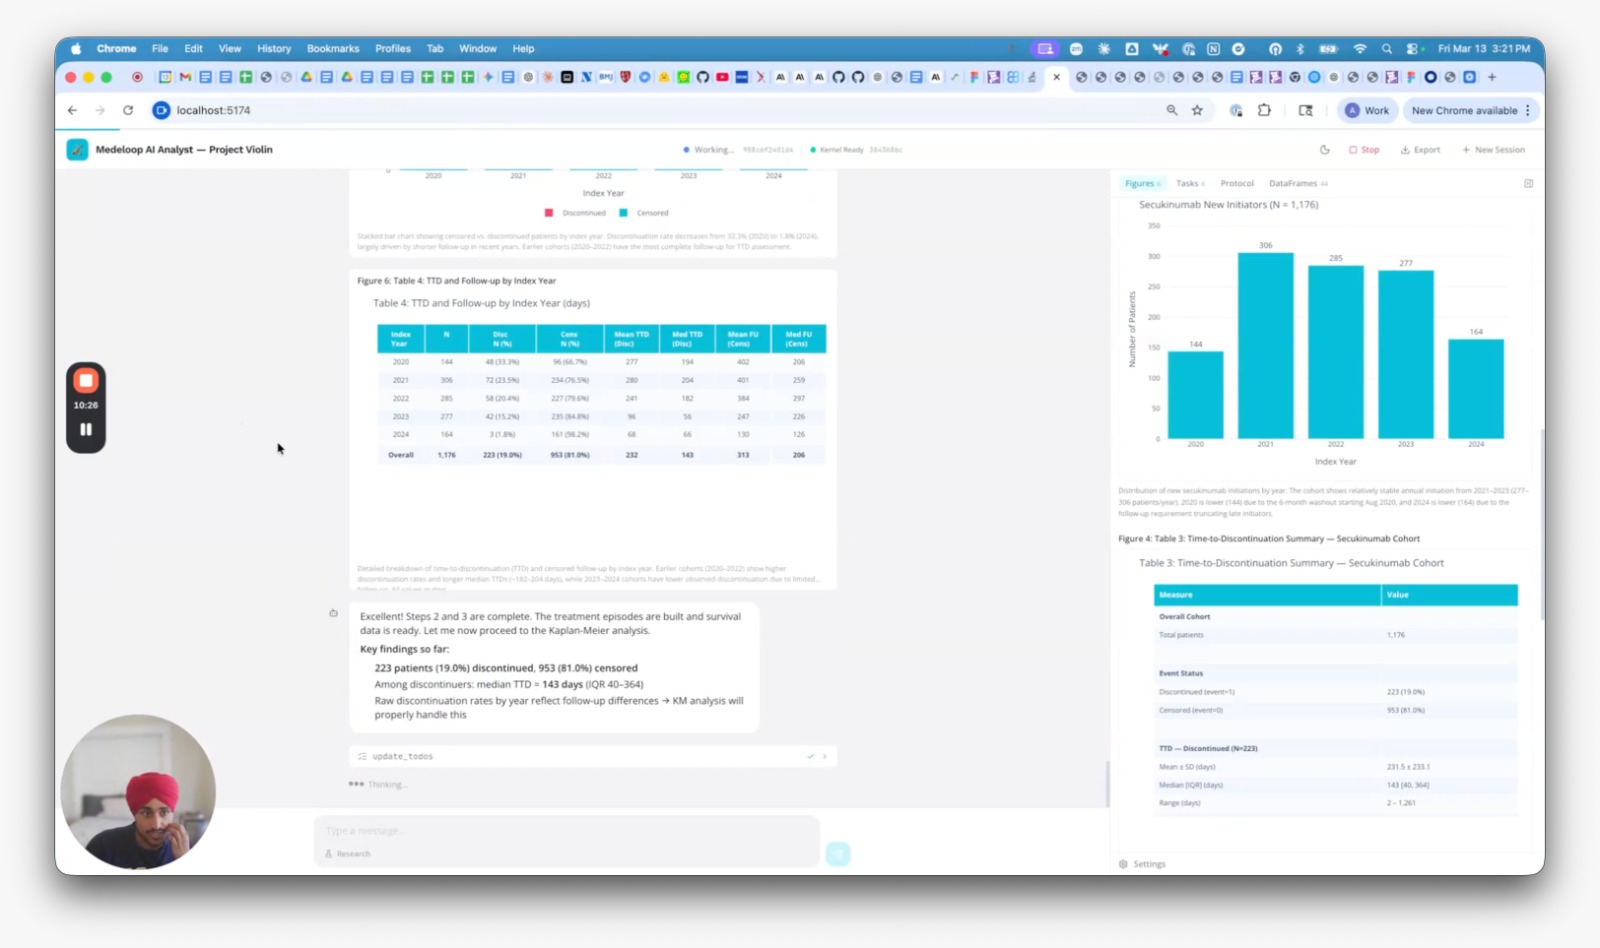
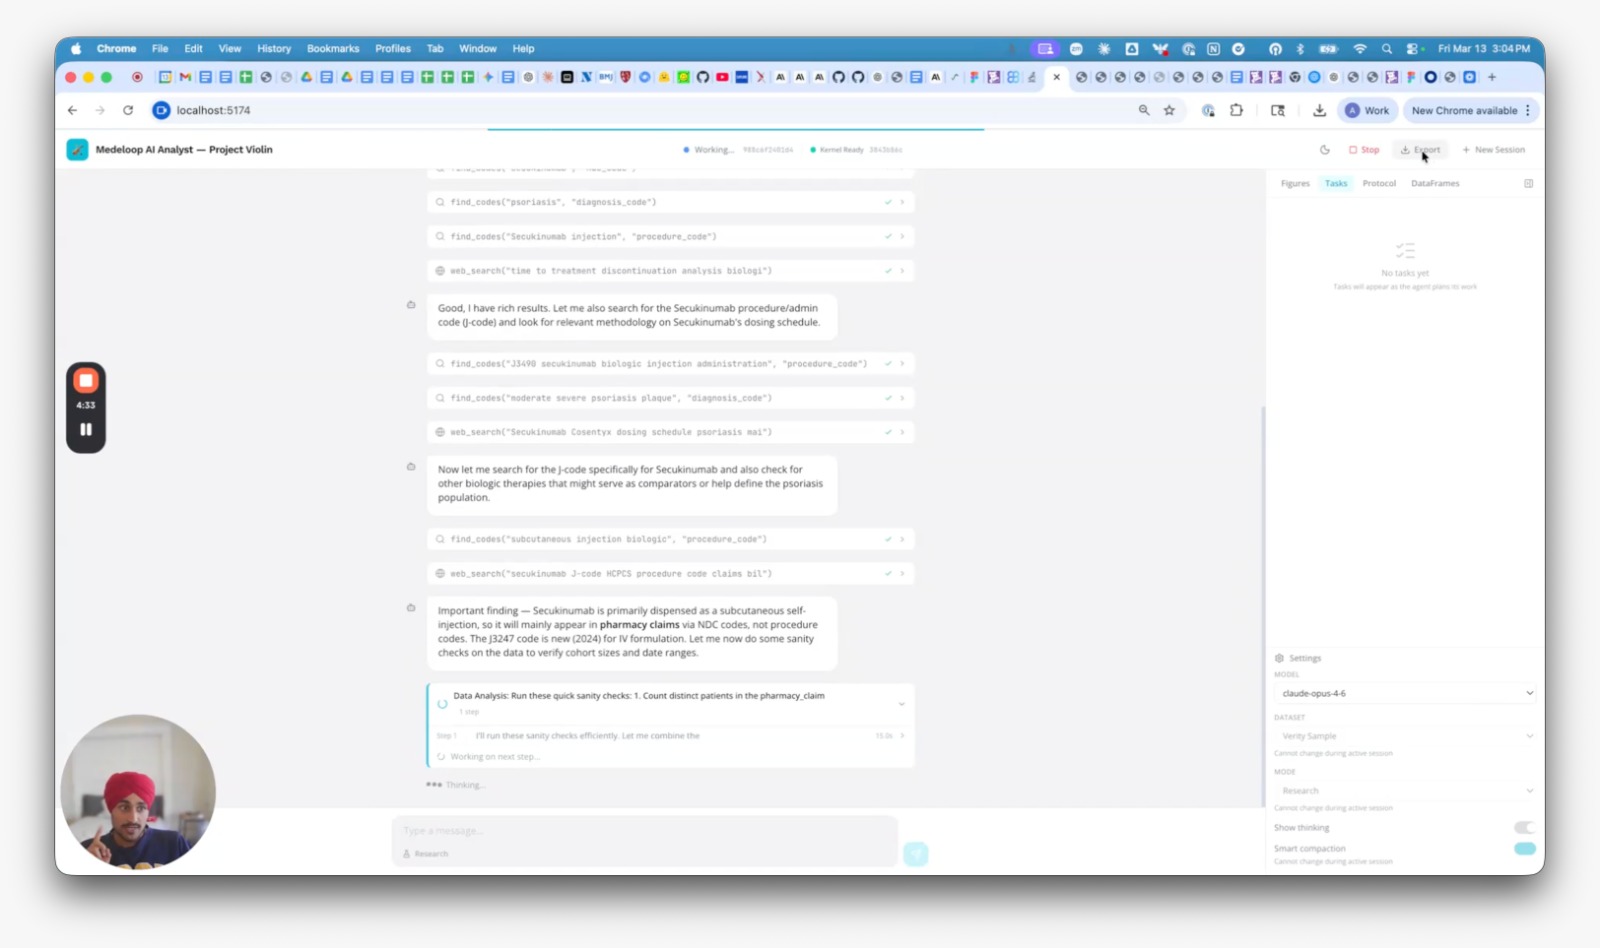
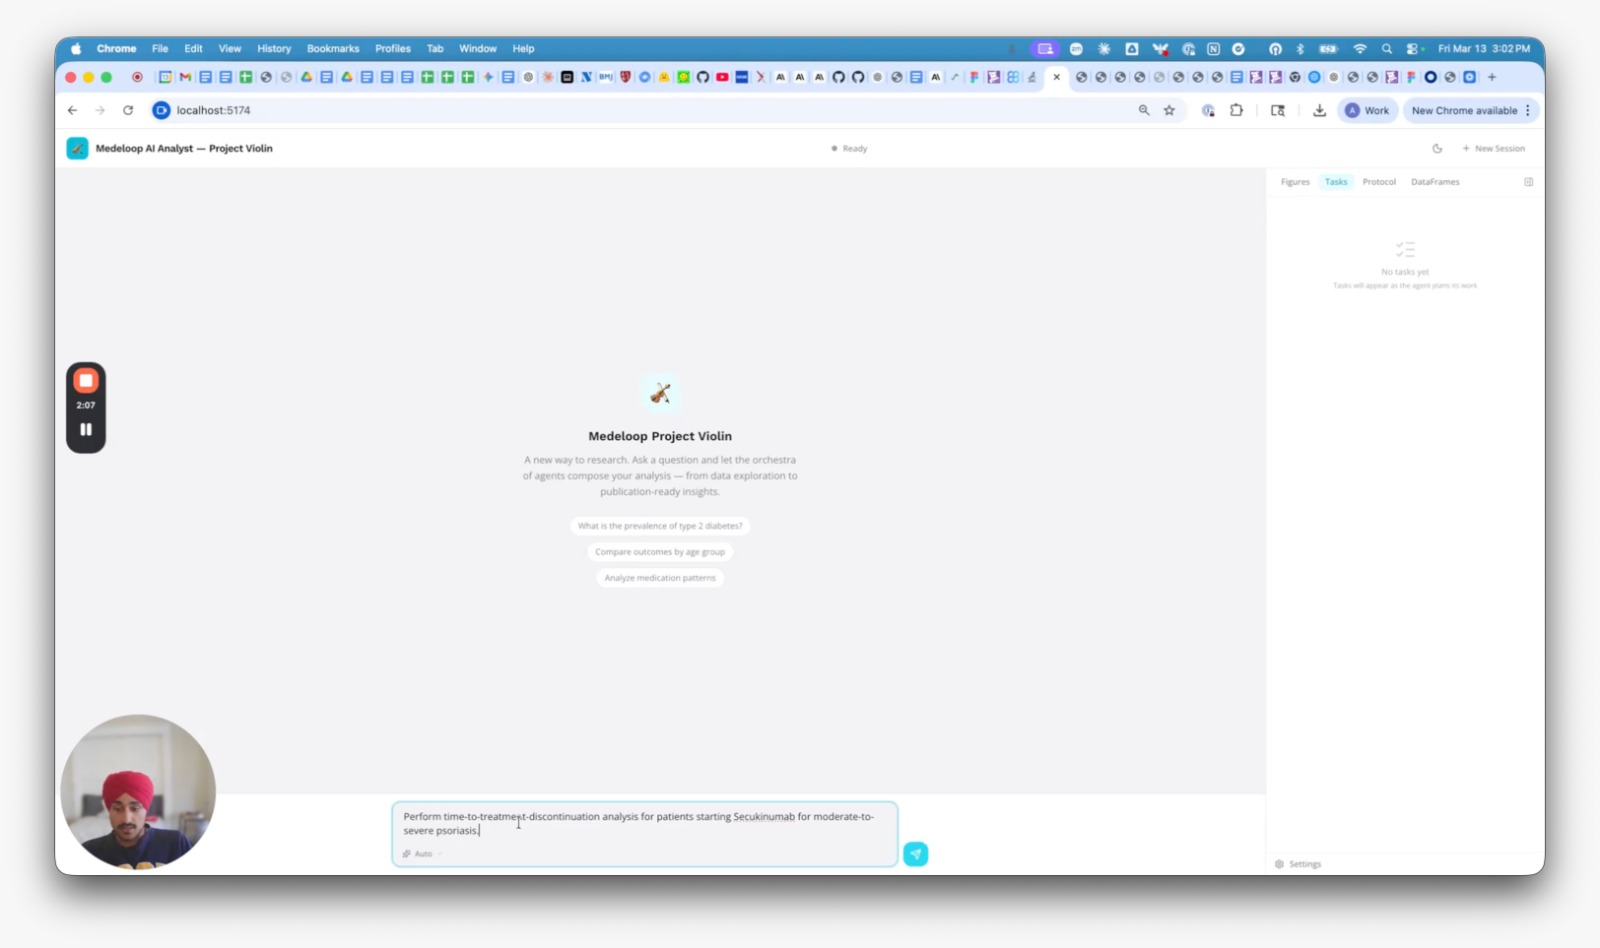
We started the design from a low fidelity PoC and creating user flows for defining the conversational interface experience. I was design lead across the full lifecycle , from shaping the interaction model and UX principles in the PRD, to committing working HTML prototypes directly to GitHub for engineering validation. This wasn't a handoff role. I was embedded across product, engineering, and clinical stakeholders throughout.


The Solution
The approach I landed on was to keep the AI conversational on the surface while preserving methodological structure underneath.
The agent speaks the language of a researcher , it uses terms like planning mode, protocol definition, and analysis execution because those are the concepts researchers think in, not abstractions we imposed on top.
The conversation feels open, but the system is always tracking where you are in the research lifecycle and what still needs to be defined before execution is possible.
The agent doesn't let you run an analysis on an undefined protocol. But it doesn't block you with an error either, it asks the right question to get you there.
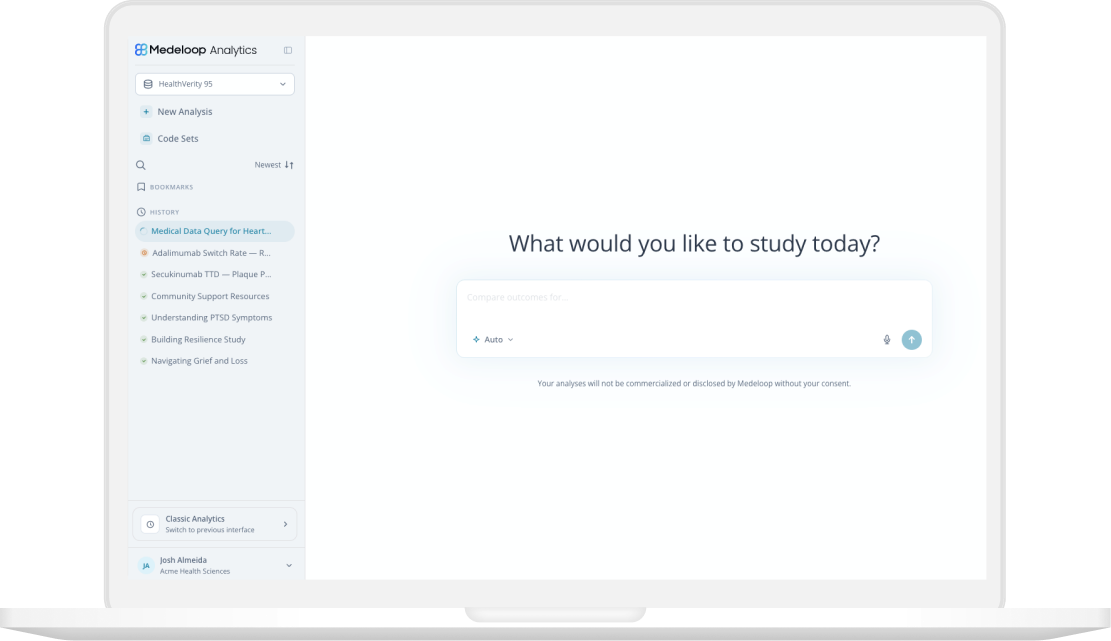


Conversational-first interface
The chat became the primary interaction layer, replacing the rigid four-step page navigation. Researchers ask questions in natural language rather than filling structured forms.
Quick-answers mode vs. full planning flow
Simple descriptive queries resolve immediately without triggering the full planning workflow; complex comparative-effectiveness questions engage the complete research-plan pattern.
Collapsible chat shelf
A dedicated interaction model letting users shift focus between the ongoing conversation and the artifact/results view without losing context.
Artifact-style structured outputs
Research plans, CONSORT diagrams, and code sets appear as reviewable artifacts embedded in the conversation, rather than separate pages, consistent with emerging AI-native product conventions.
Code-select / underlying logic view
Users can save suggested code set for use during the planning mode
Shared links
Ability to generate shareable links to a given analysis/result.
Built the full design system in light & dark mode
Beyond interaction design, I built the complete visual foundation for the Analytics Platform ,color tokens, typography scale, spacing system, and a component library in both light and dark modes. Figma was the single source of truth: every token and component documented so engineers could implement directly and stakeholders could review without interpreting a prototype.
Usability Testing
I tested the product at various stages of the project.
Figma → Claude Code → working prototype: Rather than testing static Figma frames (which can't show what a conversational AI experience actually feels like), I converted approved Figma designs into working HTML prototypes using Claude Code to test with advisors and internal users
Unmoderated testing: Real users completed hypothetical tasks inside the product using high fi prototypes
Alpha testing: before launch, a pilot group used the product in a real-world scenario.
Stanford Case Competition Feedback: before launch, a pilot group of Stanford used the product in a real-world scenario.
Seeing Results
What happened after launch, and the data that backs up the project's impact.
4-6 Weeks
Alpha shipped on scheduled
60
Researchers onboarded in the first week
86%
Improvement in task completion
Months → 90 mins
Average time from question to validated result
Project Learnings
1. Speed changes what the job even is.
Taste, prioritization, and the ability to articulate why become the whole job, that's the real skill shift when prototyping speed goes up.
- Prompting is a design skill, not a shortcut around one.
My value wasn't just visual design, it was the ability to translate between clinical intent, product requirements, and implementation reality, producing artifacts that each audience could act on without losing fidelity along the way.
3. AI didn't replace my design judgment, it raised the cost of not having any.
Prototype the medium you're designing for. If the product is conversational, the prototype has to converse.
MORE PROJECTS
Banking Experience Redesign
See the project →
Spybee: Construction Management Software
See the project →
Smart Home App Mobile Design
See the project →
Let's Connect
Feel free to reach out for collaborations or just a friendly hello 👋
